Coronado Global Resources (CODQL)·Q4 2025 Earnings Summary
Coronado Global Resources Posts $432M Loss for FY25, Resolves Going Concern Doubts
February 23, 2026 · by Fintool AI Agent
Coronado Global Resources (CODQL) reported a net loss of $432.1 million for FY 2025 ($2.58 loss per share), a significant deterioration from the $108.9 million loss in FY 2024. The results, filed in an 8-K on February 23, 2026, reflect the severe impact of weak metallurgical coal prices, with the benchmark PLV HCC FOB AUS index averaging $188.3/Mt for the year (-21.7% YoY).
Critically, management announced that the substantial doubt about the company's ability to continue as a going concern—flagged in prior interim reports—no longer exists. The resolution came after securing Stanwell's ABL facility refinancing, receiving a favorable environmental risk classification, demonstrating operational recovery, and benefiting from improving met coal prices.
What Were the Full-Year Financial Results?
The revenue decline was driven by: (1) lower average realized Met coal prices—$149.3/Mt vs $185.3/Mt in FY24, a decline of $36.0/Mt; (2) slightly reduced sales volumes of 15.6 MMt vs 15.8 MMt; and (3) sales mix weighted more toward thermal coal.
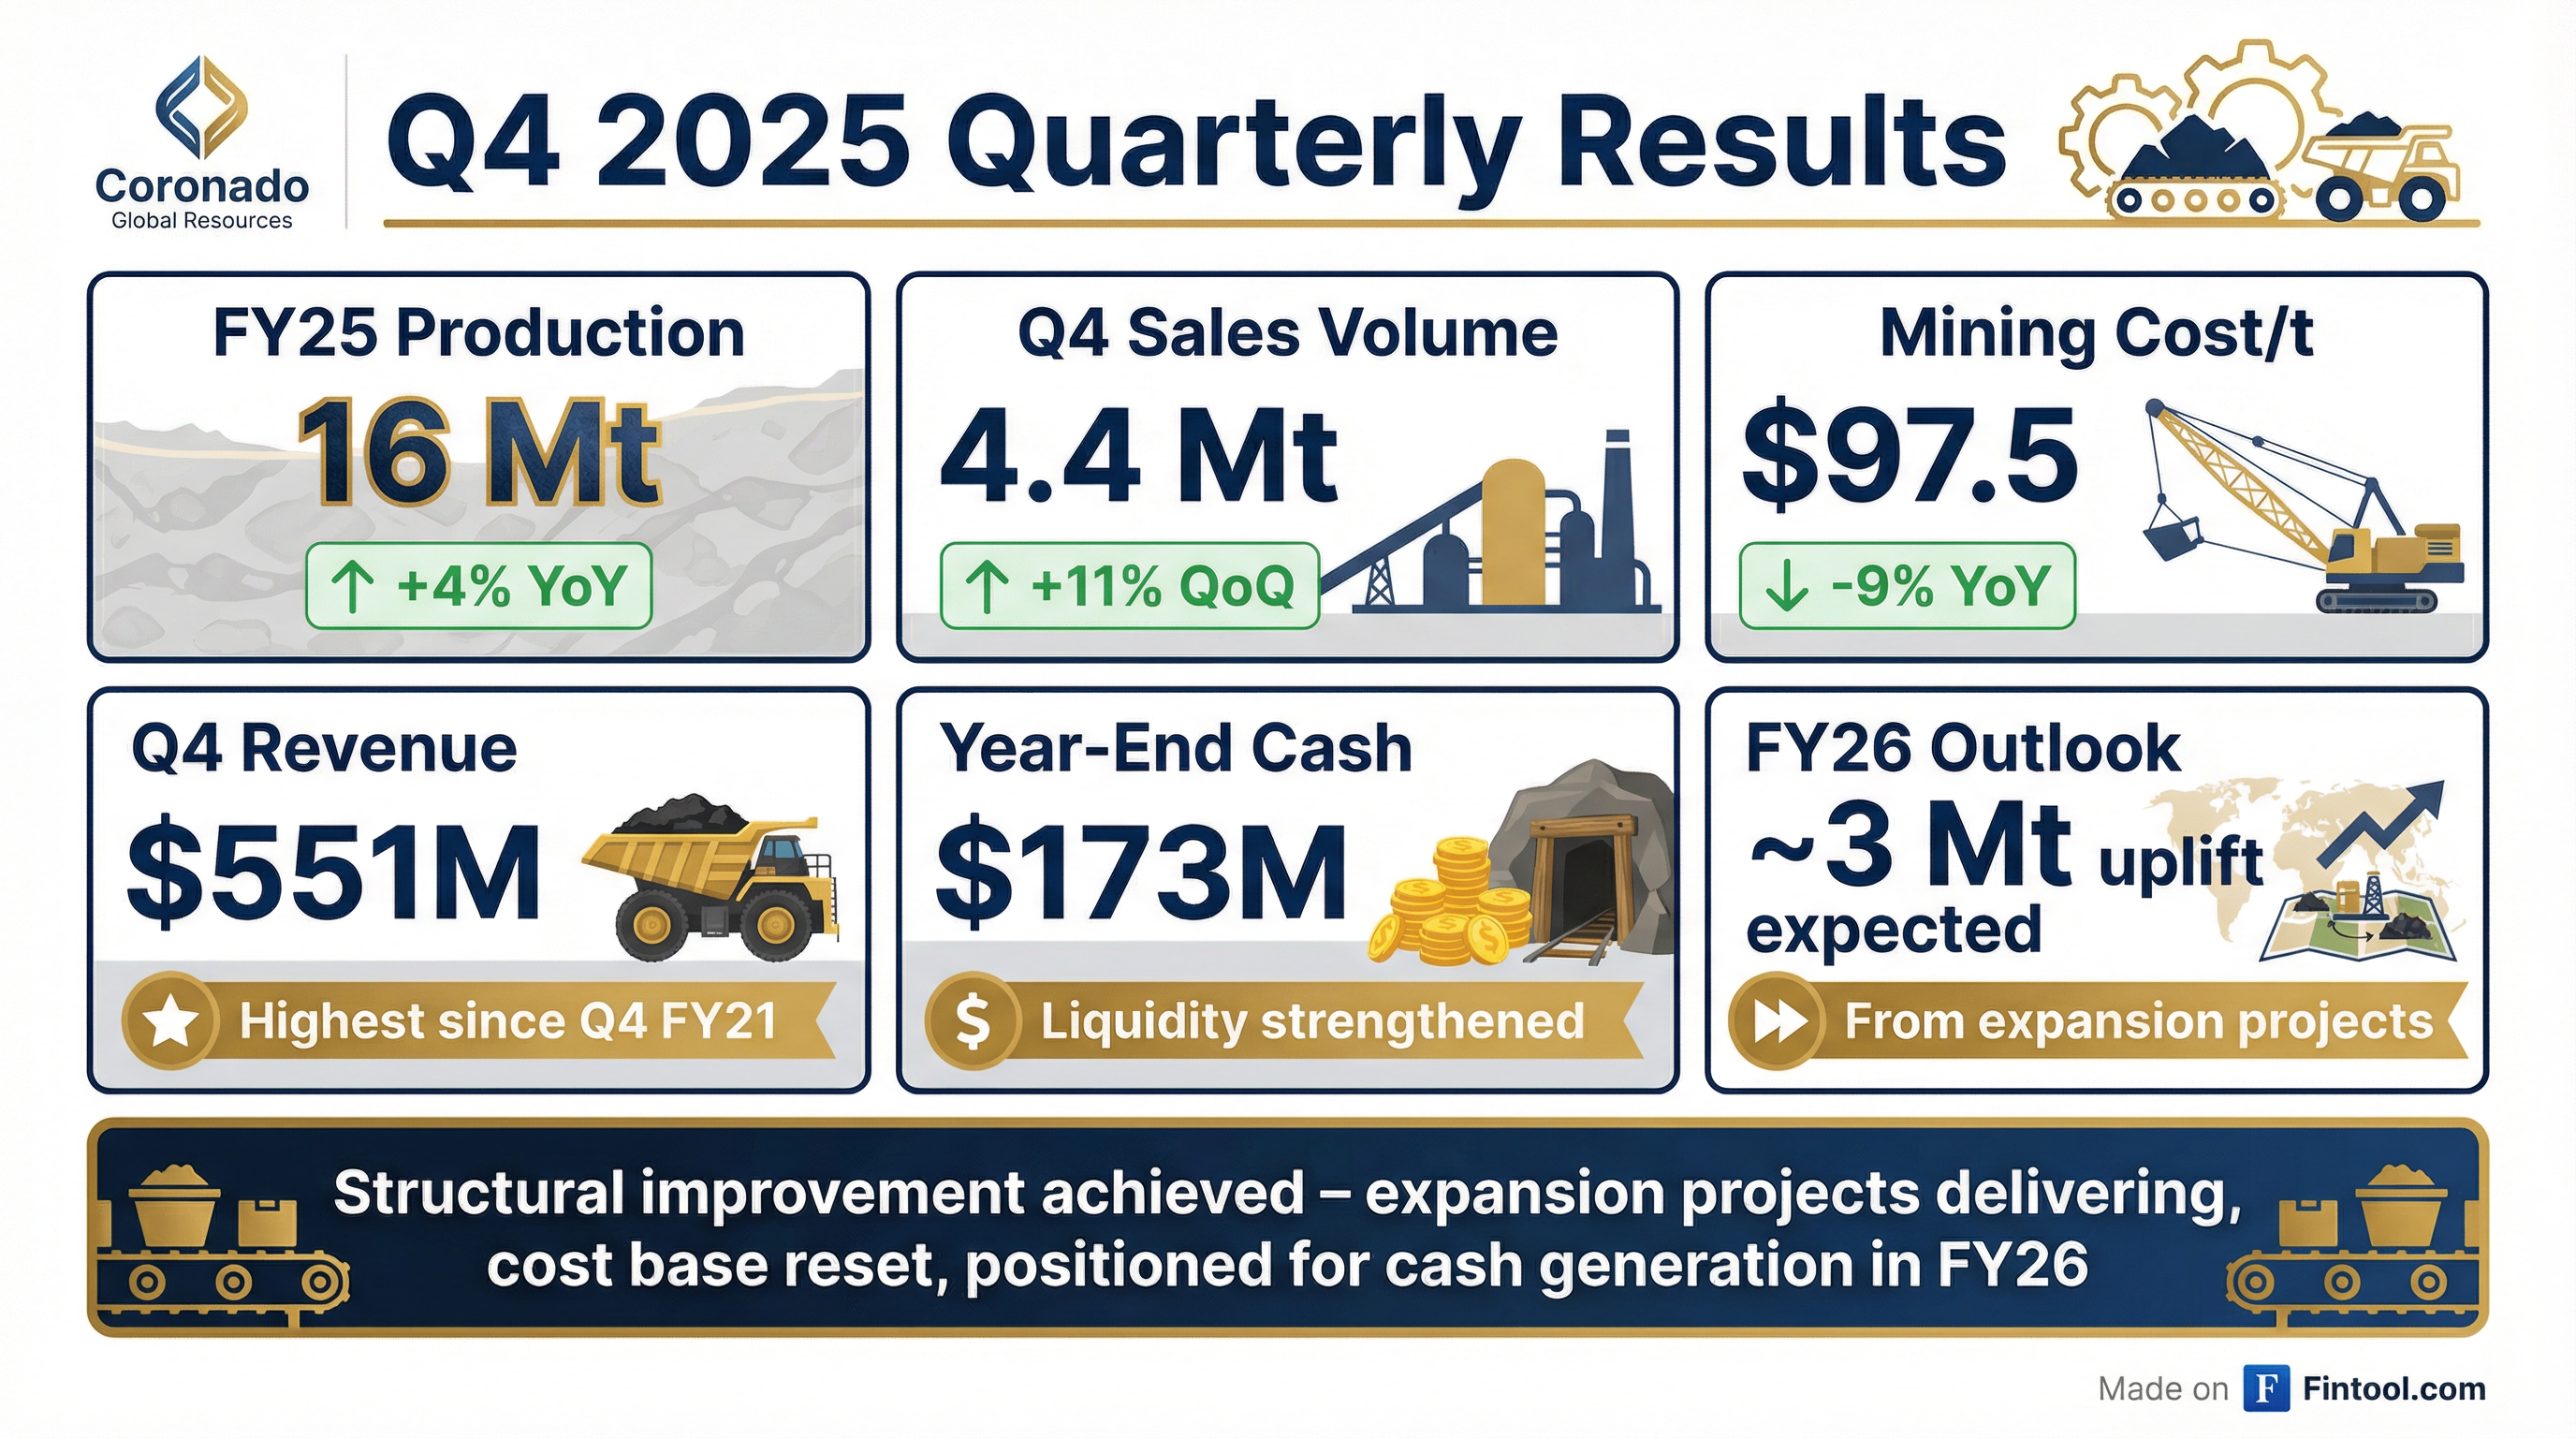
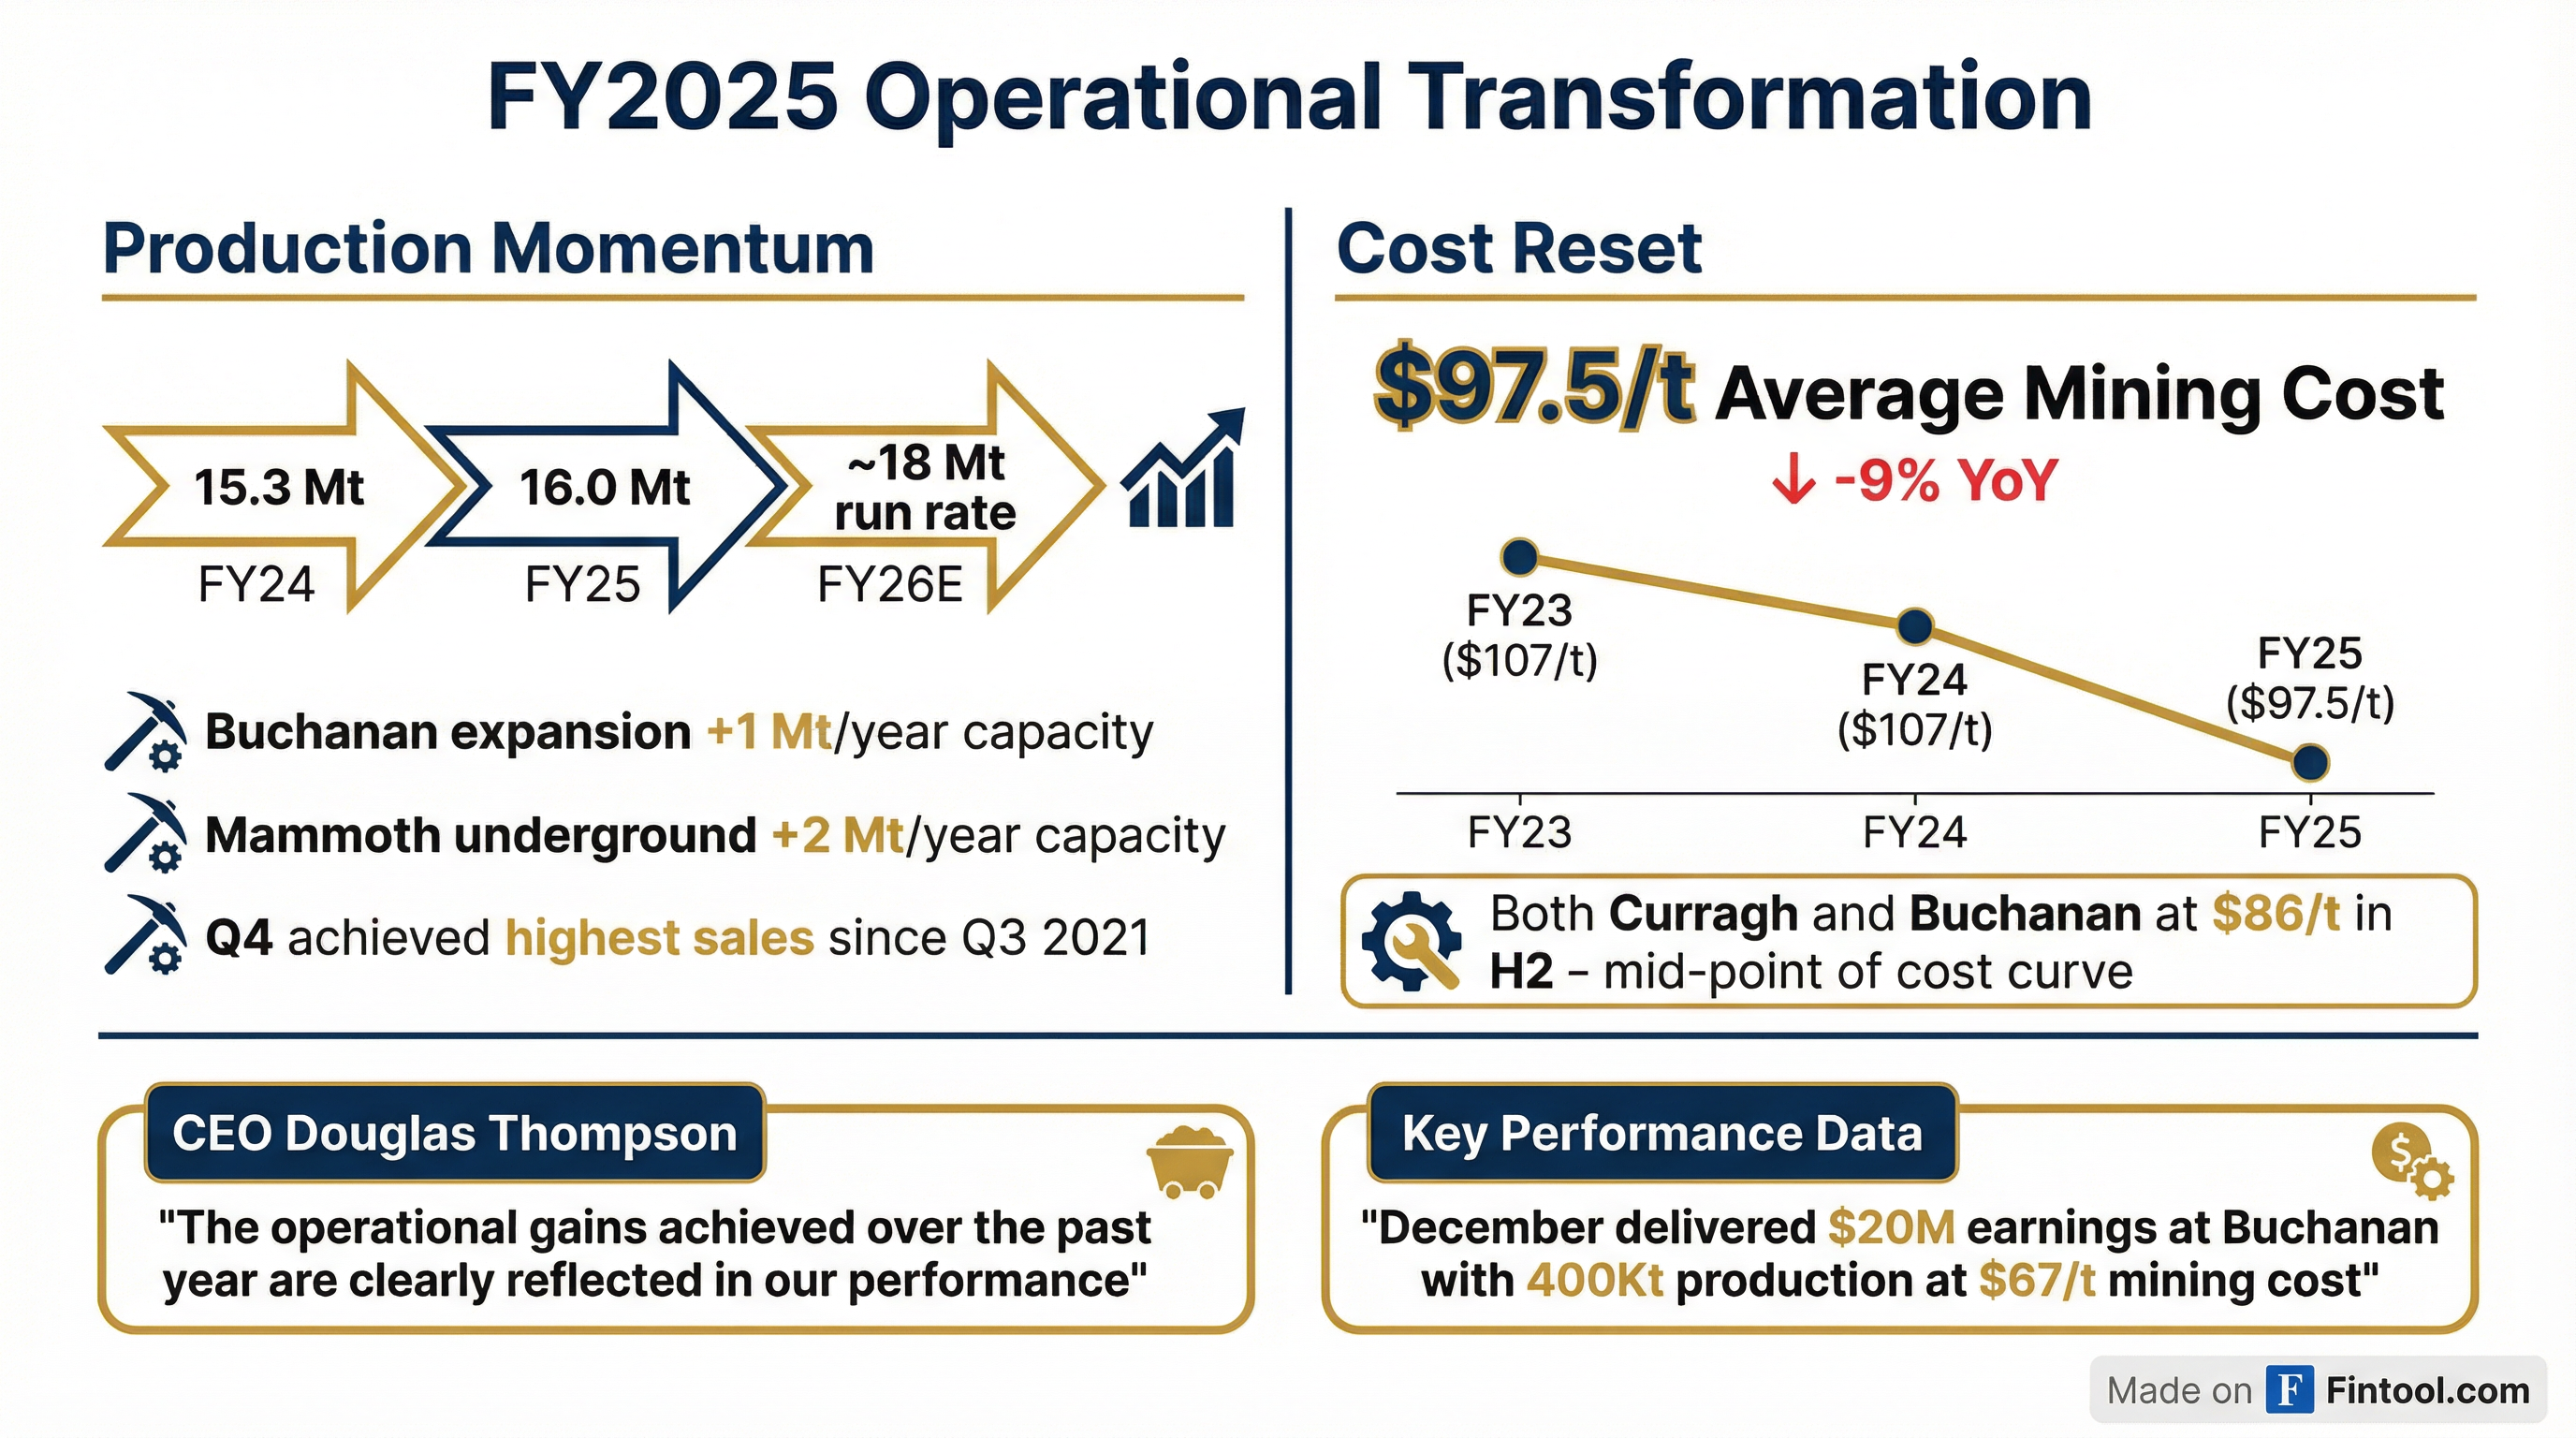
Despite the losses, Coronado achieved significant structural cost reductions. Mining costs were $165.8 million lower than 2024, reflecting contractor fleet reductions at Australian Operations, productivity improvements, and idling of surface operations at Logan. Mining costs per Mt sold improved to $97.5, a reduction of $9.9/Mt compared to 2024.
What Were the Key Operational Highlights?
The December quarter delivered the highest quarterly and half-year sales volumes since FY21, with records set for ROM production and saleable production achieving the strongest half-year results since FY19 and FY21, respectively.
How Are the Expansion Projects Performing?
Buchanan Expansion ($150M Investment)
The Buchanan expansion in the U.S. is now fully operational:
- December Buchanan generated $20M of earnings with 400 Kt of saleable production and mining costs of $67/t
- Record daily ROM production and skip counts achieved
- Record skip count average of 1,360 per day in December (+42% vs H1 2025)
- Capacity increase of ~1 Mt per year with minimal ongoing cost uplift
- 20+ year mine life secured
Mammoth Underground ($105M Investment)
- All three continuous miners fully operational since late June 2025
- Achieved run rates equivalent to 2+ Mt annualized during Q4
- Expected to add ~2 Mt per year of high-quality production at costs materially lower than historic open-cut operations
Together, these investments have delivered ~1 Mt of incremental saleable production (~0.3 Mt from Buchanan, ~0.7 Mt from Mammoth) and are expected to generate ~3 Mt on an annualized basis in FY26.
What Did Management Say About Costs?
The cost transformation was a central theme:
"Coronado delivered a significant structural improvement in cost performance in FY25, with operating costs reduced by approximately $307 million and both Curragh and Buchanan achieving Average Mining Costs Per Tonne Sold of $86/t, positioning the Company firmly within the mid-point of the cost curve." — CEO Douglas Thompson
Australian Operations (Curragh Complex):
- Average mining cost of $86/t for three consecutive quarters
- ~$20/t (~20%) improvement compared to 2023-2024
- Draglines operated at highest levels since 2018 acquisition, consistently removing 50%+ of total waste
U.S. Operations (Buchanan):
- Also averaged $86/t in H2 2025
- ~$15/t (~14%) improvement year-over-year despite challenging October/November geological conditions
What Is the Financial Position?
The full audited balance sheet as of December 31, 2025 shows:
Indebtedness Breakdown:
- Senior Secured Notes (9.25%, due 2029): $400.0M
- ABL Facility with Stanwell (9%, due 2030): $272.1M (A$406.6M)
- Curragh Housing Transaction Loan: $26.9M (A$40.4M)
As of December 31, 2025, available liquidity was $172.8 million (cash and cash equivalents excluding restricted cash). The ABL Facility was fully drawn.
Cash Flow Summary (FY 2025 vs FY 2024):
Operating cash outflow was driven by lower coal revenues, higher interest paid, and tax payments (vs refunds in 2024). This was partially offset by a $75M prepayment from Stanwell and $67.2M waiver/deferral of the Stanwell rebate. Capital expenditures totaled $244.8M (Australia: $130.6M; U.S.: $114.2M).
How Did Liquidity Improve?
The Stanwell relationship proved critical to strengthening the balance sheet:
- New ABL Facility: $265M refinancing with Stanwell at 9% interest (vs 15% under previous Oaktree facility), fully drawn on December 1, 2025
- ACSA Re-set Accelerated: The FY27 coal supply arrangement re-set was brought forward by one year
- Additional Liquidity: Potential $200-250M in additional cash flow support through FY26 via rebate waivers and prepayment mechanisms when liquidity is under $250M
The company has no significant debt maturities until 2029 (senior secured notes at 9.25%).
Did Coronado Resolve Its Going Concern Issues?
Yes. In prior interim periods, management had concluded that conditions existed that caused substantial doubt about the company's ability to continue as a going concern, primarily due to:
- Uncertainty regarding near-term liquidity
- Refinancing risk on the asset-based credit facility (with cross-default risk to Senior Secured Notes)
- Potential requirement to provide 100% financial assurance under Queensland's Financial Provisioning Act
Key developments that resolved the substantial doubt:
- Stanwell ABL Facility: New $265M facility with extended 5-year maturity and more flexible covenant terms
- Environmental Classification: Scheme Manager granted transitional relief allowing "Moderate-High" risk category (vs "High"), requiring only 6.5% of ERC as annual contribution rather than 100% financial assurance
- Operational Recovery: Demonstrated production recovery and cost improvements
- Improving Market Conditions: Met coal prices trending up from lows
Management concluded that current cash and forecasted cashflows will be sufficient to fund operations and satisfy obligations for at least one year from the financial statement issuance date.
Who Are Coronado's Major Customers?
Customer concentration remains significant:
Geographic Revenue Mix (FY 2025):
- Asia: 50%
- North America: 16%
- South America: 10%
- Europe: 9%
- Australia: 6%
- Brokered Sales: 9%
What Are the Major Contractual Obligations?
Total contractual cash obligations as of December 31, 2025: $1,549.1 million
Additionally, Asset Retirement Obligations (ARO) totaled $154.3 million as of December 31, 2025—not included in the table above.
What Is the Met Coal Market Outlook?
Prices rallied from $190/t in early October to $218/t by late December, driven by wet weather in Queensland and Chinese mine inspections tightening supplies. Management noted prices reached $230/t in mid-January 2026, with further upside possible if supply remains tight.
What Are the Key Risks and Concerns?
Fatal Incidents
Two fatal incidents occurred since mid-December 2025:
-
Logan Complex (U.S.): On December 18, 2025, operations at Logan were temporarily suspended following a fatal injury to an employee. Production subsequently resumed on December 29, 2025.
-
Curragh Complex (Australia): On January 2, 2026, following a separate fatal incident involving a worker at the Mammoth Underground Mine, operations at Mammoth were suspended. Operations were permitted to recommence on February 18, 2026. Full production from the mine is expected to be restored within Q1 2026 in accordance with all RSHQ requirements.
Safety metrics deteriorated: Australian Operations TRIFR at December 31, 2025 was 3.62 (vs 2.22 at end of 2024). U.S. Operations TRIR was 2.30 (vs 2.21 at end of 2024).
Other Risks
- Ongoing Losses: Negative EBITDA and net income persisted through FY25 due to weak met coal prices
- Commodity Price Volatility: High operating leverage means profitability is highly sensitive to met coal prices
- Weather Exposure: Cyclone Koji impacted Curragh in January 2026, though site response was improved vs prior events
- U.S. High-Vol Market Challenges: Logan's predominantly high-vol product mix faces structural market headwinds
How Has the Stock Performed?
The stock is trading above both its 50-day and 200-day moving averages, having rallied significantly from the 52-week low of $0.04. The ~6x recovery from the low reflects the resolution of going concern doubts and improving met coal prices, though shares remain well below the 52-week high of $0.42.
What Changed From Last Quarter?
The Q4 marked the inflection point management had been targeting, with expansion projects demonstrating planned run rates and the Stanwell refinancing completed.
How Did Each Segment Perform?
Australian Operations (Curragh):
U.S. Operations (Buchanan/Logan):
U.S. Operations remained profitable at the Adjusted EBITDA level despite the challenging environment, while Australian Operations swung to a significant loss driven by the steeper price declines in export markets.
What Is Management Guiding For FY26?
Key FY26 expectations from management:
- Production: ~3 Mt incremental saleable production from expansion projects
- Costs: Further improvement expected after planned CHPP upgrades early in year (may temporarily moderate Q1 production)
- Cash Generation: Positioned to convert price momentum into strong earnings and cash generation
- Capital Allocation: Prioritize debt reduction, potential for shareholder returns and balance sheet deleveraging as cash flows improve
- Strategic Options: Portfolio optimization and potential minority asset sales provide additional optionality
Key Takeaways
-
Severe Losses in Weak Price Environment: Net loss of $432M ($2.58/share) on revenue down 22% to $1.95B, driven by met coal prices 19% lower than 2024
-
Going Concern Resolved: Substantial doubt about going concern eliminated after Stanwell refinancing, favorable environmental classification, and improving market conditions
-
Structural Cost Improvements Hold: Mining costs $97.5/Mt (-9% YoY) with both Curragh and Buchanan at $86/Mt in H2—positioned for operating leverage as prices recover
-
Expansion Projects Delivering: Buchanan and Mammoth now at run rate, expected to add ~3 Mt production in FY26
-
Liquidity Tight But Stable: $172.8M cash, ABL fully drawn, but no major maturities until 2029 and additional Stanwell support mechanisms in place
-
Safety Incidents Resolved: Both Logan and Mammoth operations have resumed following fatal incidents; TRIFR deteriorated but operations back online
-
High Customer Concentration: Top 5 customers = 51% of revenue; Tata Steel (18%) and ArcelorMittal (12%) are largest
This analysis incorporates Coronado Global Resources' FY 2025 Appendix 4E and audited financial statements filed via 8-K on February 23, 2026 (document pH5QRAzqync).